How to Monitor Azure Service Bus
- 2 Minutes to read
- Print
- DarkLight
- PDF
How to Monitor Azure Service Bus
- 2 Minutes to read
- Print
- DarkLight
- PDF
Article Summary
Share feedback
Thanks for sharing your feedback!
If you take advantage of Azure Service Bus, you will likely want to keep an eye on your Queues, Topics, and Subscriptions. Here's how to do it.
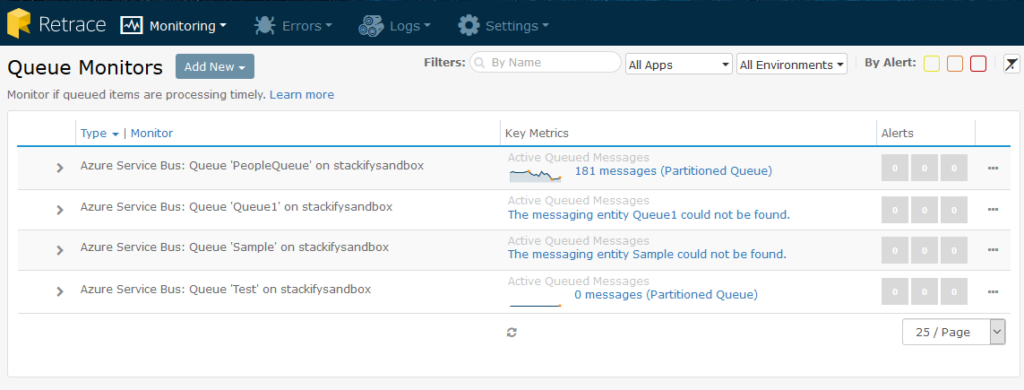
Configuring Service Bus Queues
From the Queue Monitors page, you will be able to add new Azure Queue and RabbitMQ Monitors.
Azure Queues
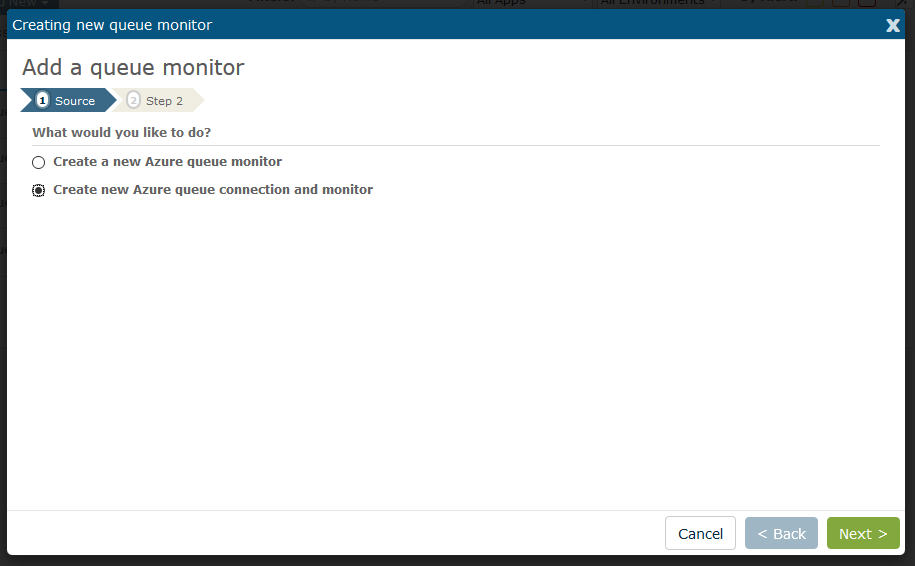
Configure an Azure Connection
You will have an option to create a monitor from an existing queue connection or create a new connection to be monitored. If you have not set up a connection, select the option as shown above.
Azure Portal Info
You will need to login to your Azure Management Portal to obtain some information. Below we show you how to get the fields that you need.
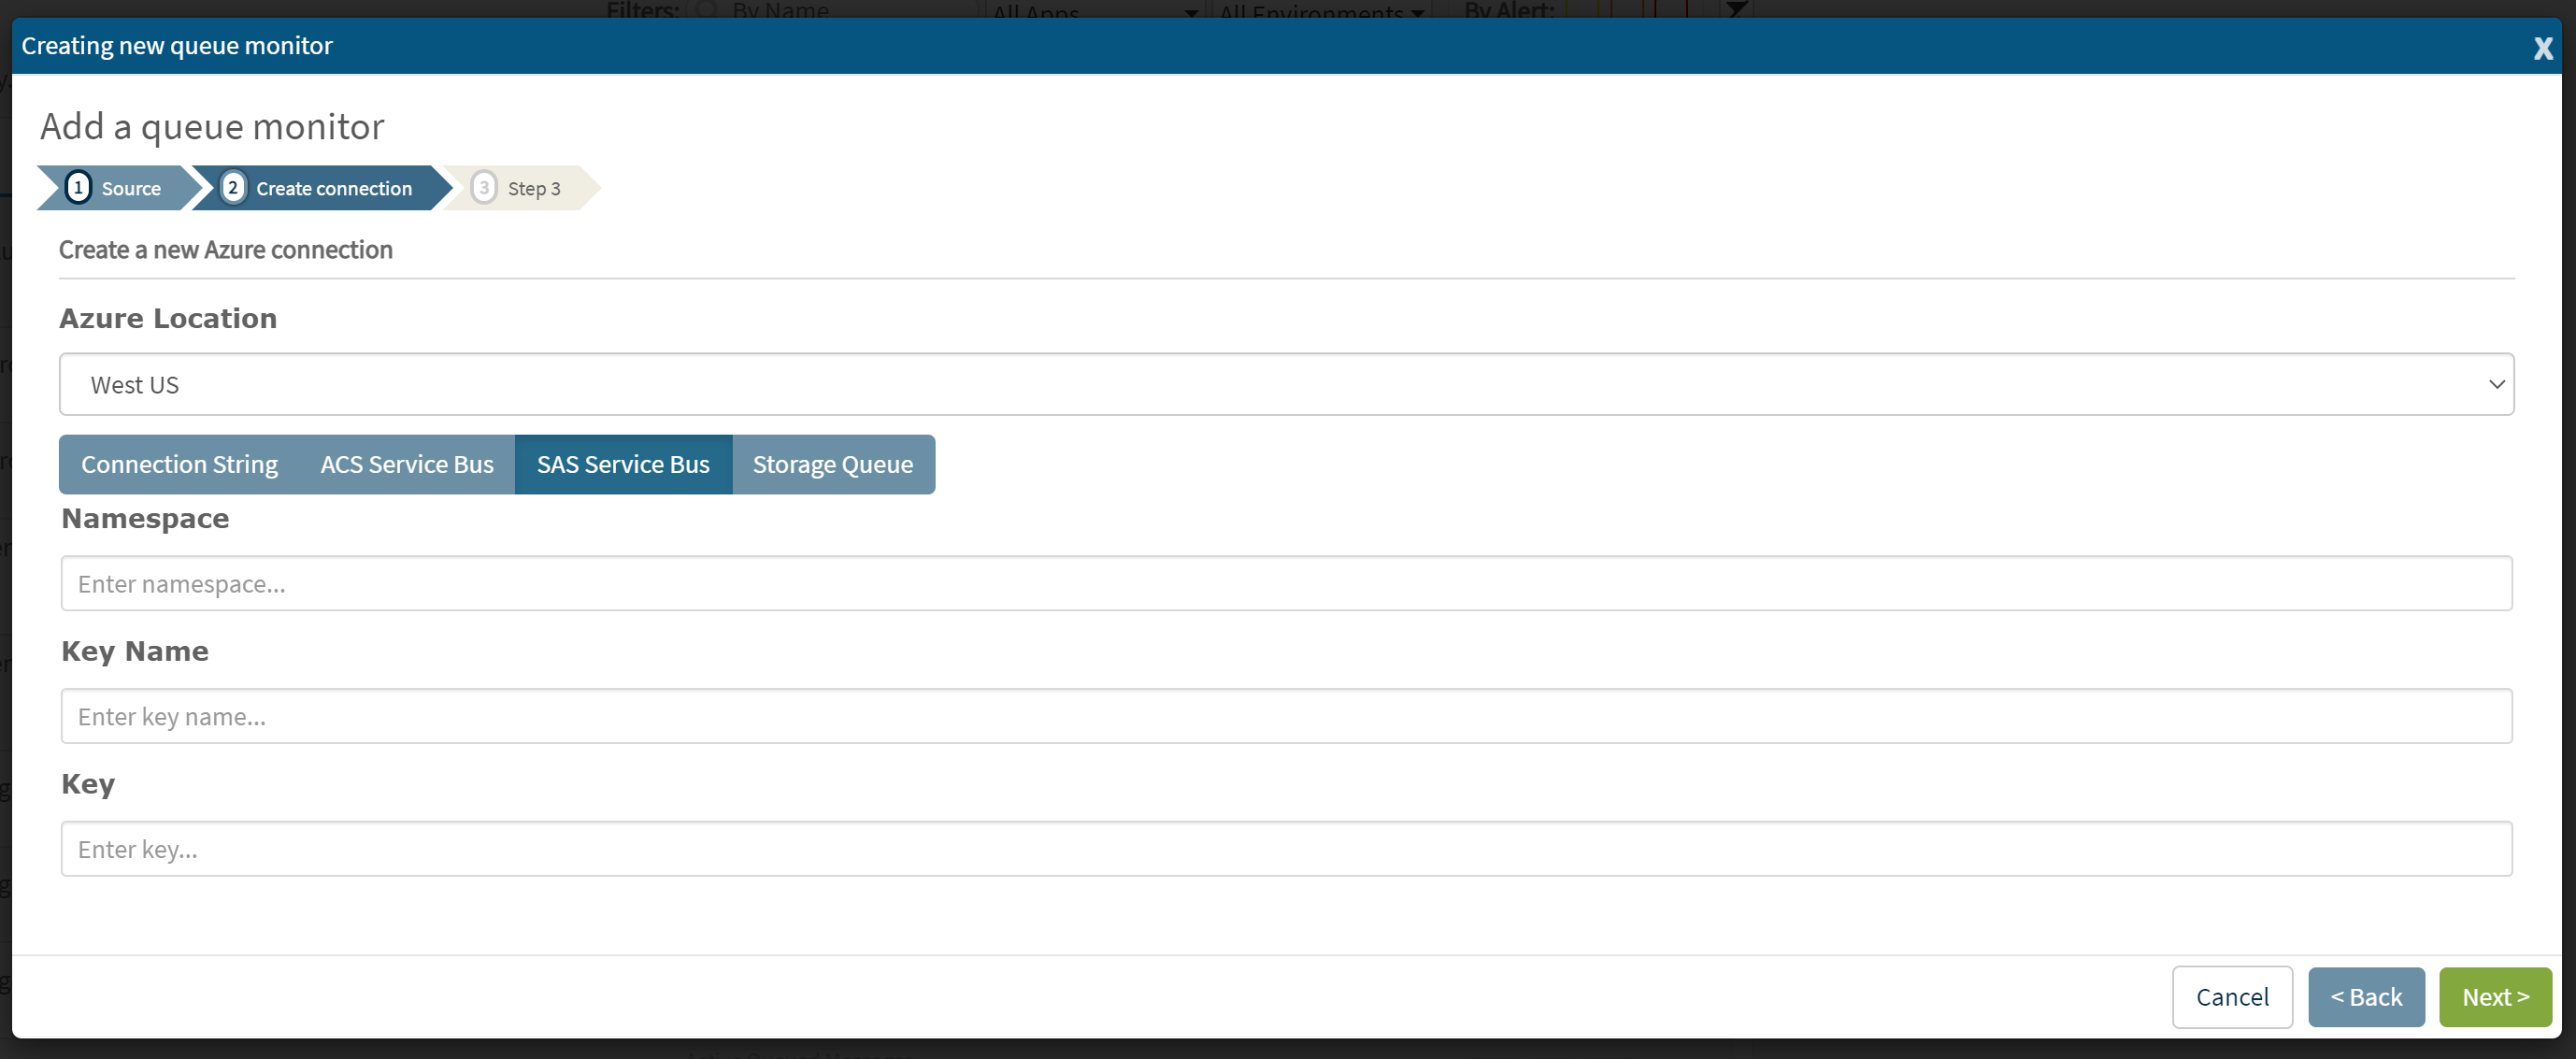
Add Azure Connection Details
You will need the namespace, which you can get from the Service Bus screen. Then, click on the namespace to get the rest of the info you will need.
Under the Namespace you are wanting to monitor, click "Shared access policies" under the Settings section and you will see Keys that map to fields asked for in the Retrace configuration screen. You also have the ability to create a new policy in the Azure Portal that can be used by Retrace's monitor. Click the Copy icon to get your key so you can paste it into the Retrace configuration screen.
Once you get this information from Azure, provide the connection details in Retrace to connect to your Service Bus.
You will need to reference your Queues and Topics as well in the setup process.
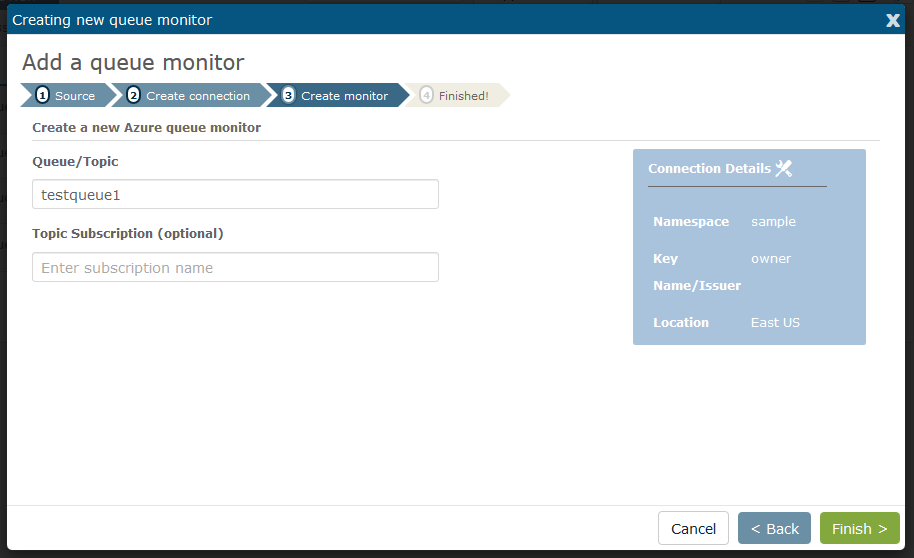
Add an Azure Service Bus Queue
Enter either your Queue name, or your Topic name and Subscription name that you want to monitor here. In this example, we're just configuring monitoring for a queue (as seen above in the Azure management portal screen shot).
Configure Your Monitors, Alerts, and Notifications
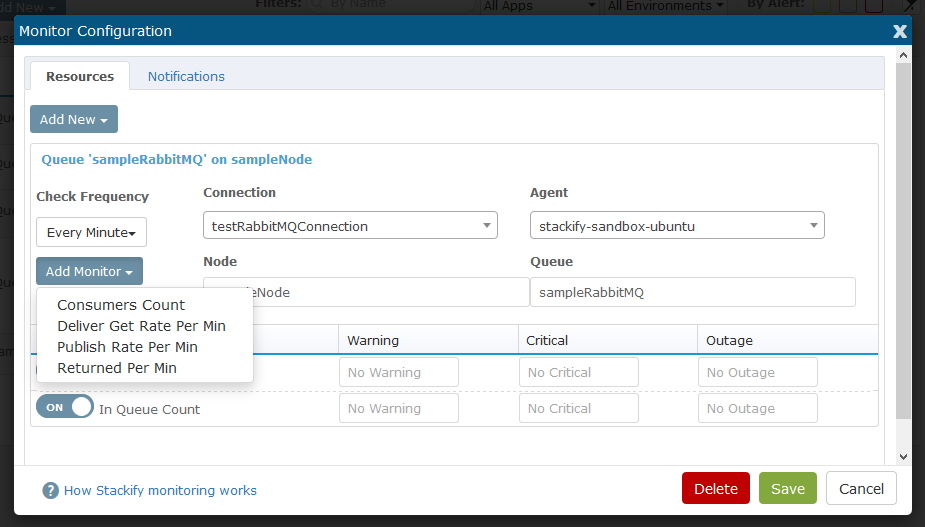
Be sure to specify the monitor interval (which applies to all monitors for that Queue or the Topic-Subscription pair), which monitors you want to be active, what your Alert levels should be (if any), and who should be notified in the event of an Alert threshold being eclipsed.
Don't Forget to Save!
After you have made all of these configuration changes, don't forget to save! It's easy to get carried away adding different queues, topics/subscriptions, and monitor configurations and then forget to finalize your changes.
Note: The subscription count monitor only applies to Topics/Subscriptions and not Queues.
RabbitMQ Monitors
There are a couple of prerequisites needed in order to complete a new RabbitMQ Monitor configuration:
- You will need an existing RabbitMQ connection. If you have not set one up yet, follow this guide to get started.
- You will also need an agent installed on a Linux device. If you have not done this yet, you can get started here.
Create a new Queue Monitor
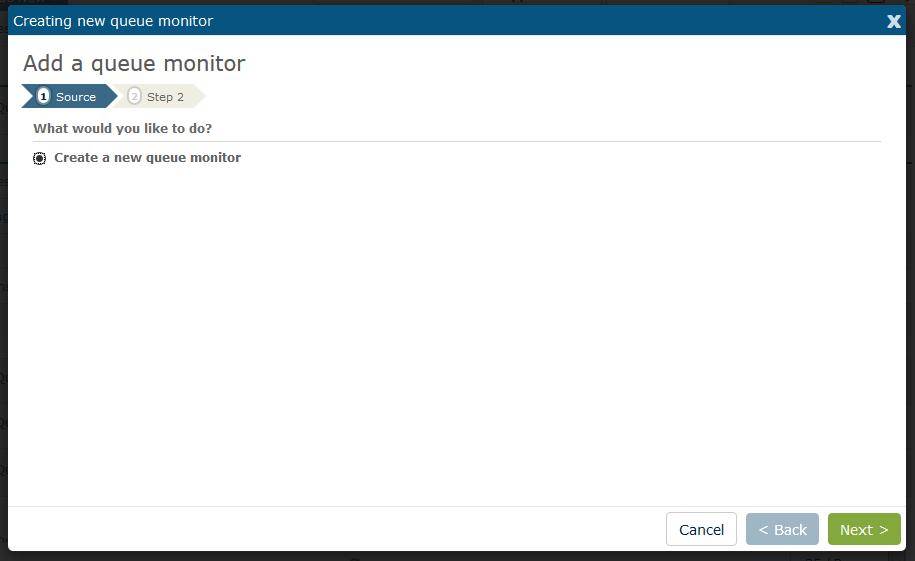
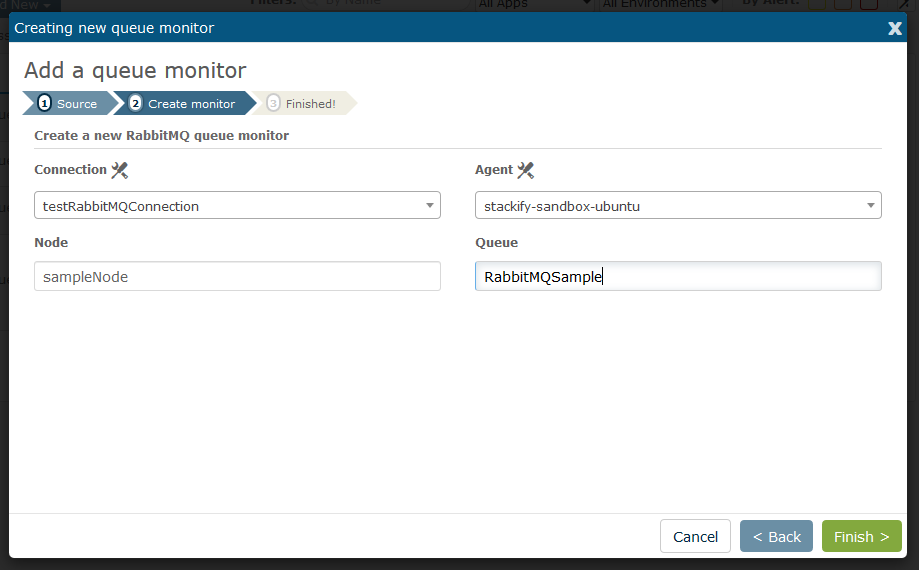
Select RabbitMQ Connection and Linux Agent
Configure Your Monitors, Alerts, and Notifications
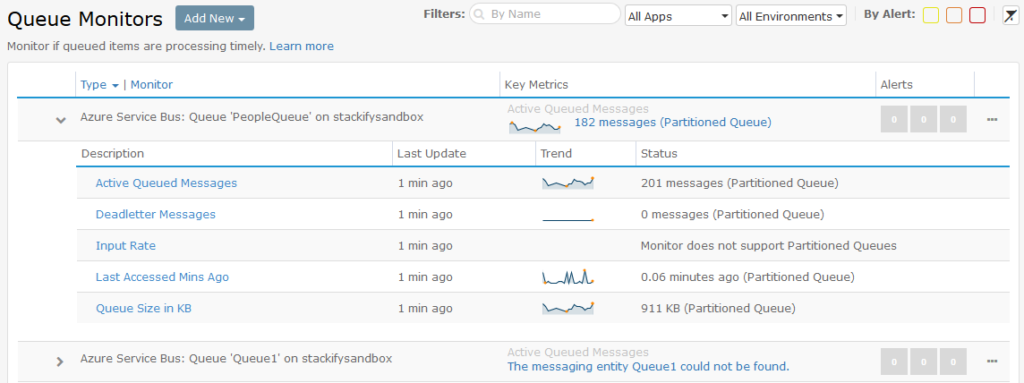
Monitoring Your Queues
Now you can keep track of your queues and spot trends quickly that can tell you something isn't right or indicate that you need to scale. For example, if your queue length frequently backs up, message age creeps higher, or I/O ratio goes beyond a threshold you're comfortable with (indicating you are writing to the queue faster than you can read from it), you can easily be notified before things get out of hand.
Was this article helpful?