Server Dashboard
- 2 Minutes to read
- Print
- DarkLight
- PDF
Server Dashboard
- 2 Minutes to read
- Print
- DarkLight
- PDF
Article Summary
Share feedback
Thanks for sharing your feedback!
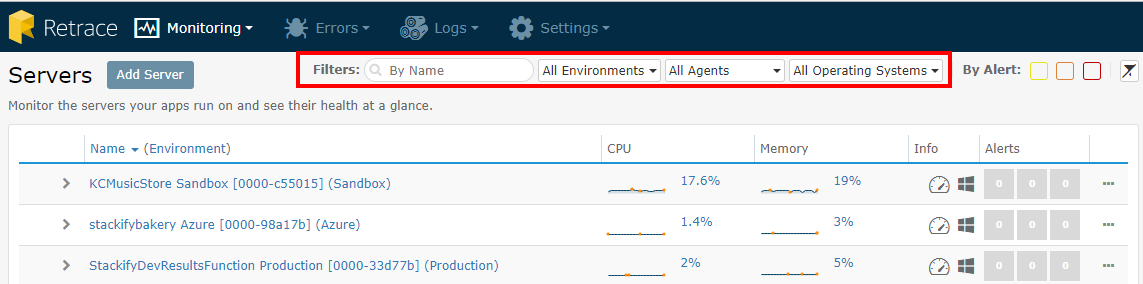
On this page you will get an overview of all the active servers installed on your account, which can be grouped and displayed by Operating System or Environment. Here is where you can view the Server Dashboard, Remove the Server, view the Server Details, Modify Monitors, and Manage Access.
Server Dashboard
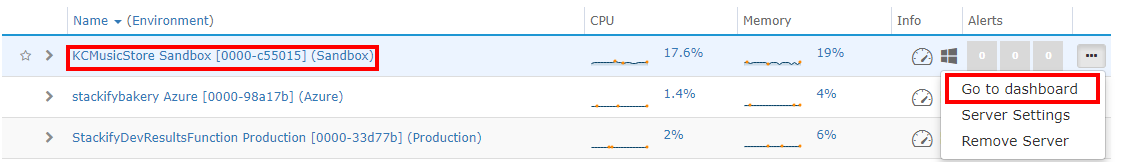
In the Server Dashboard view, you get access to a lot more power and information on that machine - useful for investigating issues, reviewing log files and Events, checking config files, seeing what has changed on the server, and more. The Server Dashboard is found by clicking the server name in the server list or by selecting the settings icon found on the right of the server name.
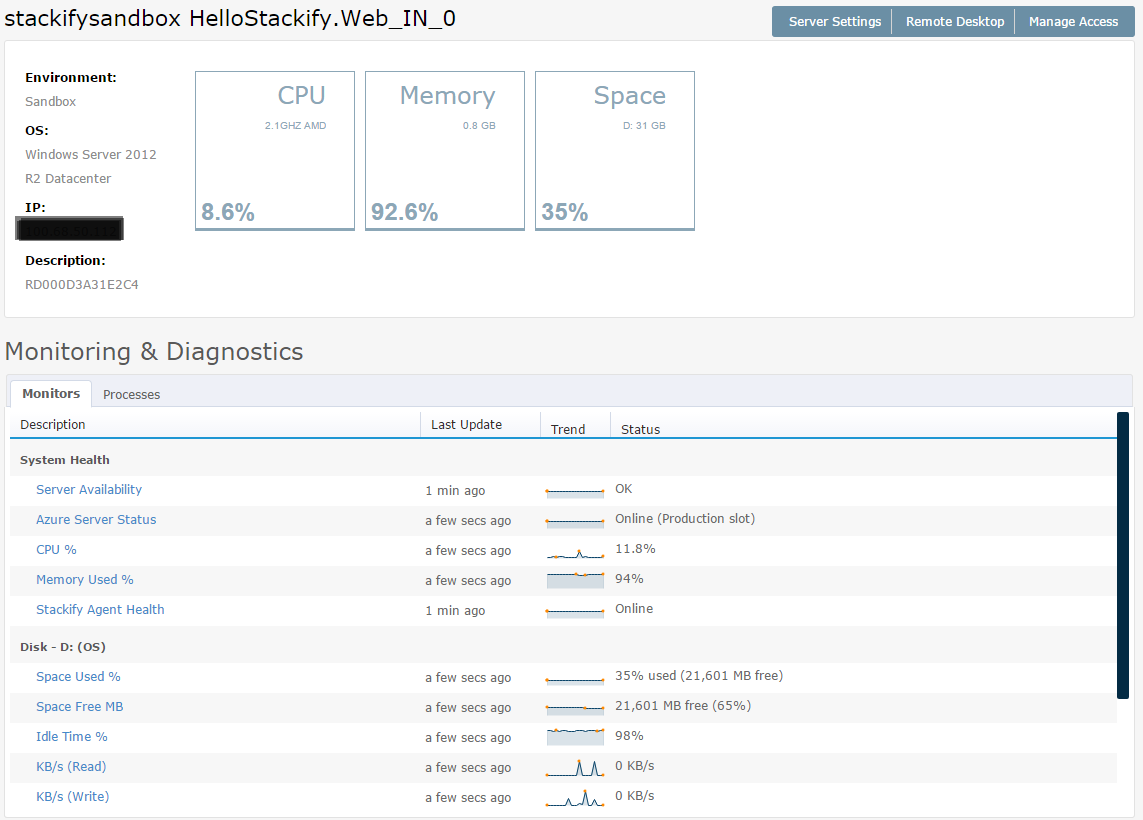
The Server Dashboard gives you an overview of the status of the server. You can easily view the health and status of a particular server and what processes are running. You can also view details about the services, scheduled tasks, application pools (if .NET), and metrics about disk space & network utilization.
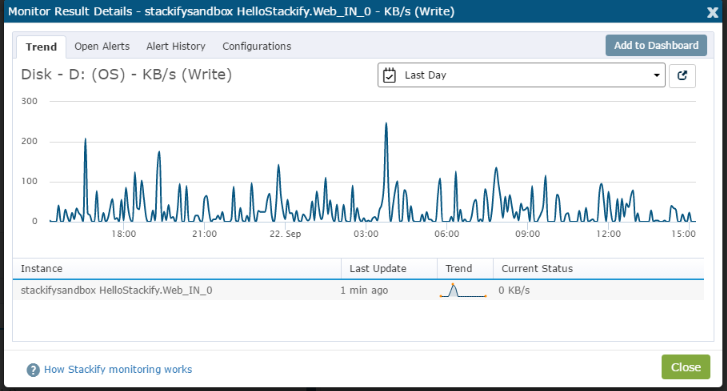
By clicking on each spark line trend in the Server Dashboard, you can see trend data as far back as 30 days with a quick selection, or refine your view to just the time frame you care about by using a Custom Range. While selecting a custom range, note that Summary Data will be retained for one year.
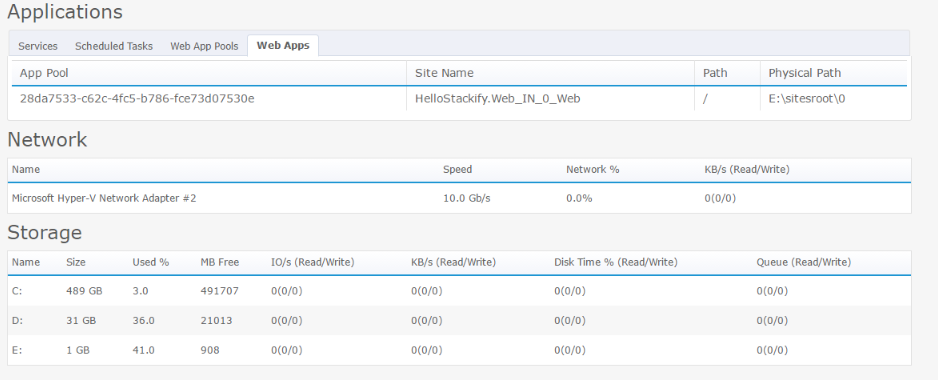
The Server Dashboard also lets you see what Apps and services are running on the server, giving you quick access to everything on the machine.
Server Settings
Server Settings allows you to view important information about a particular server. The server’s assigned Environment and Monitoring Template can be changed using the drop-down boxes. You can also control whether or not a device will be removed from the list of active servers if it stops sending data for 24 hours (this option is selected by default).
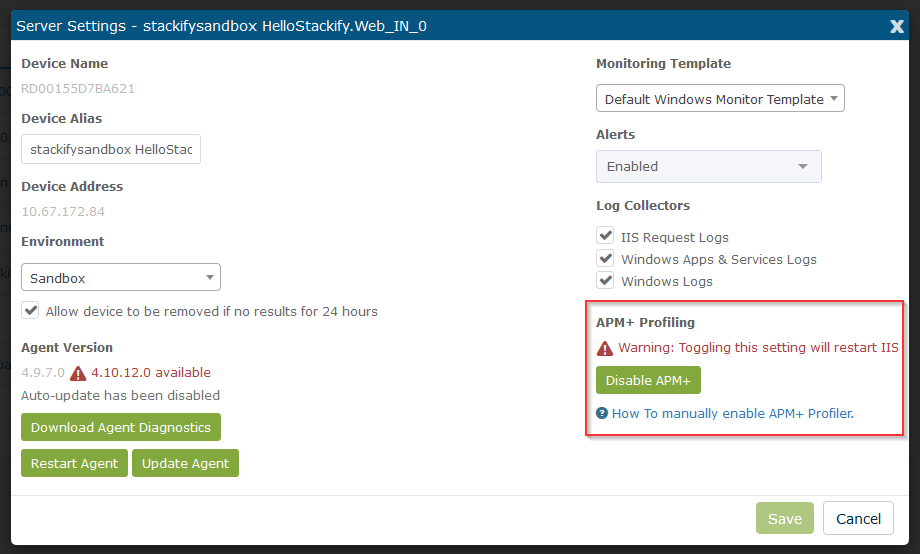
Download Agent Diagnostics: This option packages all the files in the Stackify directory into a compressed file to send to the Stackify support team in to help troubleshoot account issues.
Restarting the Agent: Occasionally used during troubleshooting, Stackify support personnel may request that you restart your monitoring agent. On those occasions, instead of logging in to the server, you can simply send the Restart command from Server Details.
Updating the Agent: Ordinarily, Stackify will automatically update your agent when a new version is available. If for some reason the agent does not update automatically, the agent can manually be updated here.
You have the option to disable all alerts for a given server. You can also control the behavior of the log collector at a server specific level. To read more about the collection of IIS Request Logs and Windows Event Logs, view our documentation on Log Collectors.
Was this article helpful?