- Welcome to Retrace
- Installing Retrace
- Account Setup
- Application Performance
- Centralized Logging
- Error Monitoring
- Monitoring Configuration
- Overview
- Application Monitoring Overview
- Application Monitoring Configuration
- Windows Performance Counters
- How to Monitor Key Transactions
- How to Monitor Your Logs
- How to Monitor Azure Service Bus
- Server Monitoring Templates
- How to Monitor SQL Queries
- How to Monitor Websites
- How to Monitor Files
- Log Query Monitor Best Practices
- Alerts and Notifications
- FAQs
- Deployment Tracking
- RUM Setup Guide
- OTel Support
- .NET Setup Guide
- Getting Started
- APM Setup Guides
- New vs Legacy Profiler
- Legacy .NET Profiler Guide
- Supported Technologies
- .NET APM on Windows
- .NET APM on Linux
- .NET APM with Docker (Linux)
- .NET APM with Kubernetes
- Custom Instrumentation
- APM Troubleshooting Guide
- Agent Installation Options
- How to Profile Windows Services
- Azure Deployments
- AWS Deployments
- Advanced APM Topics
- .NET Logging Guide
- .NET API Library
- Examples
- Java Setup Guide
- APM Setup Guides
- Java APM on Linux
- Java APM on Windows
- Java APM with Docker
- Java APM with Kubernetes
- Java APM with AWS ECS
- Java APM with AWS Fargate
- Java APM with AWS Lambda
- Java APM with Heroku
- Java APM Troubleshooting Guide
- Support for Java Background Services
- How to Collect Servlet Web Request Details
- Custom Instrumentation
- Supported Java Technologies
- Getting Started
- Logging Setup Guides
- Java API Library
- Examples
- APM Setup Guides
- PHP Setup Guide
- Getting Started with PHP
- APM Setup Guides
- PHP APM with Linux
- PHP APM with Docker
- PHP APM with Kubernetes
- PHP APM with AWS ECS
- PHP APM with AWS Fargate
- PHP APM with AWS Elastic Beanstalk
- PHP APM with AWS Lambda
- PHP APM with Plesk
- PHP APM with Heroku
- PHP APM Troubleshooting Guide
- Custom Instrumentation
- Advanced Configuration
- Supported PHP Technologies
- Logging Setup Guides
- Node.js Setup Guide
- Getting Started
- APM Setup Guides
- Node.js APM with Linux / Windows
- Node.js APM with Docker
- Node.js APM with Kubernetes
- Node.js APM with AWS ECS
- Node.js APM with AWS Fargate
- Node.js APM with AWS Lambda
- Node.js APM with AWS Elastic Beanstalk
- Node.js APM with Heroku
- Node.js APM Troubleshooting Guide
- Custom Instrumentation
- Supported Node.js Technologies
- Logging Setup Guides
- Ruby Setup Guide
- Getting Started
- APM Setup Guides
- Ruby APM with Linux / Windows
- Ruby APM with Docker
- Ruby APM with Kubernetes
- Ruby APM with Heroku
- Ruby APM with Scalingo
- Ruby APM with AWS ECS
- Ruby APM with AWS Fargate
- Ruby APM with AWS Lambda
- Ruby APM with AWS Elastic Beanstalk
- Ruby APM Troubleshooting
- Custom Instrumentation
- Advanced Configuration
- Supported Ruby Technologies
- Logging Setup Guides
- Python Setup Guide
- Integrations
- Prefix
- What is Prefix?
- Getting Started
- Updates In Prefix
- Distributed Tracing
- Missing Spans
- Search Syntax
- Open Telemetry Support
- Using Prefix with .NET
- Using Prefix with Java
- Using Prefix with PHP
- Using Prefix with Node.js
- Using Prefix with Ruby
- Using Prefix with Python
- Prefix Premium
- Troubleshooting
- Data Collection Policy
- Release Notes
- Windows Agent Release Notes 2025
- Linux Agent Release Notes 2024
- Profiler Updates 2024
- 2024
- 2023
- 2022
- 2021
- 2020
- 2019
- December Platform Release
- Windows Agent 4.24
- November 19, 2019 - Platform
- October 15, 2019 - Platform
- Windows Agent 4.23
- September 19, 2019 - Platform
- Windows Agent 4.22
- August 27, 2019 - Platform
- August 1, 2019 - Platform
- Windows Agent 4.21
- July 11, 2019 - Platform
- July 1, 2019 - Platform
- Windows Agent 4.20
- June 4, 2019 - Platform
- Linux Agent 2.20
- May 15, 2019 - Platform
- April 16, 2019 - Platform
- April 2, 2019 - Platform
- March 19, 2019 - Platform
- Windows Agent 4.19
- March 11, 2019 - Platform
- Linux Agent 2.17
- February 6, 2019 - Platform
- January 17, 2019 - Platform
- January 8, 2019 - Platform
- Linux Agent 2.16
- 2018
- December 19, 2018 - Platform
- December 2018 - Platform
- November 2018 - Platform
- Linux Agent 2.15.5
- Windows Agent 4.18.8
- October 2018 - Platform
- Windows Agent 4.17.20
- Windows Agent 4.17.19
- Linux Agent 2.14.3
- September 2018 - Platform
- Windows Agent 4.17.14
- Windows Agent 4.17.11
- August 2018 - Platform
- July 2018 - Windows Agent 4.16
- July 2018 - Platform
- June 2018 - Platform
- April 2018 - Platform
- March 2018 - Platform
- March 2018 - Windows Agent 4.14
- March 2018 - Linux Agent 2.9
- February 2018 - Platform
- February 2018 - Windows Agent 4.13
- January 2018 - Windows Agent 4.12
- January 2018 - Windows Agent 4.11
- January 2018 - Linux Agent 2.8
- January 2018 - Linux Agent 2.6
- January 2018 - StackifyLib 2.1
- Other Announcements
- Insights
- Website Monitoring and Alerting
- Alert Notification and Escalation
- Leveraging Retrace for the Different Application Support Levels
- Application Cloud Migration and Re-architecture Journey
- Using Retrace as a key DevOps CI/CD automation tool
- ITIL v4 Service Management – Service Operations Processes
- Problem Management – Key to Achieving Operational Excellence
- OTel Appliance - Put your serverless and containerized apps on Retrace
- Open Telemetry: Under The Hood
Retrace supports profiling Azure WebJobs. Azure WebJobs provide an easy way to run scripts or programs as background processes in the context of an Azure App Service.
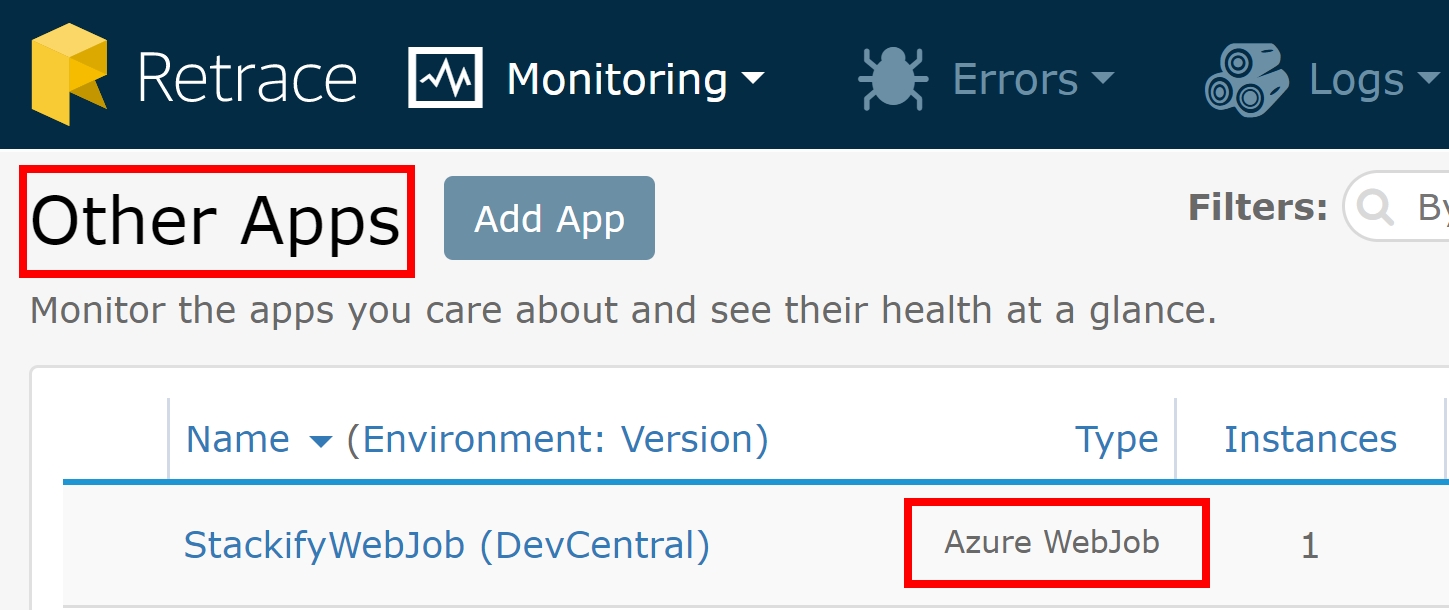
Retrace will provide all of the same great insights to application performance as it does for web applications and windows services. Within Retrace, WebJobs will be monitored in 'Other Apps' and will be listed as 'Azure WebJob".

Installation
Step 1: Add Site Extension in the Azure Portal
This is done just like it is for normal App Services with Retrace. For WebJobs, select your app and then go to Platform Features -> Extensions -> Add -> Select the Stackify APM or Retrace extension.
Step 2: Add App Settings in the Azure Portal
Within your Web App, go to Platform Features -> Settings -> Application Settings Under "Application settings" add these 3 settings:
Stackify.ApiKey=enter_your_key
COR_ENABLE_PROFILING=1
COR_PROFILER={de70e25c-02b5-4556-a837-8aa6fe502668}Add one of the following, depending on if you are running the app in 32 or 64 bit mode:
COR_PROFILER_PATH_32=D:\home\Stackify\Profiler\Latest\x86\StackifyProfiler_x86.dll

COR_PROFILER_PATH_64=D:\home\Stackify\Profiler\Latest\x64\StackifyProfiler_x64.dllStep 3: Create a "ProfileProcess.txt" file
This is a JSON formatted file that can define one or many EXEs to profile. It is recommended to save this with ANSI encoding to prevent issues parsing the JSON.
[{
    "exe": "WebJobContinuous.exe"
}]Save this file in the same folder as the .exe that is being profiled. This would allow you to easily “bin deploy” the file with your app.
Step 4: Define Operations to be Tracked
Tracking custom transactions is done by using the ProfilerTracer object within StackifyLib. This creates a defined operation from start to finish that can be named and tracked as a single operation. Here is a simple code example:
//Create a new ID for the operation for correlation
Trace.CorrelationManager.ActivityId = Guid.NewGuid();

//name the operation whatever you want
var tracer = StackifyLib.ProfileTracer.CreateAsOperation("Operation Name", Trace.CorrelationManager.ActivityId.ToString());

tracer.Exec(() =>   //FYI, async code is also supported via tracer.ExecAsync()
{
    //Do some stuff here
});
