Contents x
- Welcome to Retrace
- Installing Retrace
- Account Setup
- Application Performance
- Centralized Logging
- Error Monitoring
- Monitoring Configuration
- Overview
- Application Monitoring Overview
- Application Monitoring Configuration
- Windows Performance Counters
- How to Monitor Key Transactions
- How to Monitor Your Logs
- How to Monitor Azure Service Bus
- Server Monitoring Templates
- How to Monitor SQL Queries
- How to Monitor Websites
- How to Monitor Files
- Log Query Monitor Best Practices
- Alerts and Notifications
- FAQs
- Deployment Tracking
- RUM Setup Guide
- OTel Support
- .NET Setup Guide
- Getting Started
- APM Setup Guides
- New vs Legacy Profiler
- Legacy .NET Profiler Guide
- Supported Technologies
- .NET APM on Windows
- .NET APM on Linux
- .NET APM with Docker (Linux)
- .NET APM with Kubernetes
- Custom Instrumentation
- APM Troubleshooting Guide
- Agent Installation Options
- How to Profile Windows Services
- Azure Deployments
- AWS Deployments
- Advanced APM Topics
- .NET Logging Guide
- .NET API Library
- Examples
- Java Setup Guide
- APM Setup Guides
- Java APM on Linux
- Java APM on Windows
- Java APM with Docker
- Java APM with Kubernetes
- Java APM with AWS ECS
- Java APM with AWS Fargate
- Java APM with AWS Lambda
- Java APM with Heroku
- Java APM Troubleshooting Guide
- Support for Java Background Services
- How to Collect Servlet Web Request Details
- Custom Instrumentation
- Supported Java Technologies
- Getting Started
- Logging Setup Guides
- Java API Library
- Examples
- APM Setup Guides
- PHP Setup Guide
- Getting Started with PHP
- APM Setup Guides
- PHP APM with Linux
- PHP APM with Docker
- PHP APM with Kubernetes
- PHP APM with AWS ECS
- PHP APM with AWS Fargate
- PHP APM with AWS Elastic Beanstalk
- PHP APM with AWS Lambda
- PHP APM with Plesk
- PHP APM with Heroku
- PHP APM Troubleshooting Guide
- Custom Instrumentation
- Advanced Configuration
- Supported PHP Technologies
- Logging Setup Guides
- Node.js Setup Guide
- Getting Started
- APM Setup Guides
- Node.js APM with Linux / Windows
- Node.js APM with Docker
- Node.js APM with Kubernetes
- Node.js APM with AWS ECS
- Node.js APM with AWS Fargate
- Node.js APM with AWS Lambda
- Node.js APM with AWS Elastic Beanstalk
- Node.js APM with Heroku
- Node.js APM Troubleshooting Guide
- Custom Instrumentation
- Supported Node.js Technologies
- Logging Setup Guides
- Ruby Setup Guide
- Getting Started
- APM Setup Guides
- Ruby APM with Linux / Windows
- Ruby APM with Docker
- Ruby APM with Kubernetes
- Ruby APM with Heroku
- Ruby APM with Scalingo
- Ruby APM with AWS ECS
- Ruby APM with AWS Fargate
- Ruby APM with AWS Lambda
- Ruby APM with AWS Elastic Beanstalk
- Ruby APM Troubleshooting
- Custom Instrumentation
- Advanced Configuration
- Supported Ruby Technologies
- Logging Setup Guides
- Python Setup Guide
- Integrations
- Prefix
- What is Prefix?
- Getting Started
- Updates In Prefix
- Distributed Tracing
- Missing Spans
- Search Syntax
- Open Telemetry Support
- Using Prefix with .NET
- Using Prefix with Java
- Using Prefix with PHP
- Using Prefix with Node.js
- Using Prefix with Ruby
- Using Prefix with Python
- Prefix Premium
- Troubleshooting
- Data Collection Policy
- Release Notes
- Windows Agent Release Notes 2025
- Linux Agent Release Notes 2024
- Profiler Updates 2024
- 2024
- 2023
- 2022
- 2021
- 2020
- 2019
- December Platform Release
- Windows Agent 4.24
- November 19, 2019 - Platform
- October 15, 2019 - Platform
- Windows Agent 4.23
- September 19, 2019 - Platform
- Windows Agent 4.22
- August 27, 2019 - Platform
- August 1, 2019 - Platform
- Windows Agent 4.21
- July 11, 2019 - Platform
- July 1, 2019 - Platform
- Windows Agent 4.20
- June 4, 2019 - Platform
- Linux Agent 2.20
- May 15, 2019 - Platform
- April 16, 2019 - Platform
- April 2, 2019 - Platform
- March 19, 2019 - Platform
- Windows Agent 4.19
- March 11, 2019 - Platform
- Linux Agent 2.17
- February 6, 2019 - Platform
- January 17, 2019 - Platform
- January 8, 2019 - Platform
- Linux Agent 2.16
- 2018
- December 19, 2018 - Platform
- December 2018 - Platform
- November 2018 - Platform
- Linux Agent 2.15.5
- Windows Agent 4.18.8
- October 2018 - Platform
- Windows Agent 4.17.20
- Windows Agent 4.17.19
- Linux Agent 2.14.3
- September 2018 - Platform
- Windows Agent 4.17.14
- Windows Agent 4.17.11
- August 2018 - Platform
- July 2018 - Windows Agent 4.16
- July 2018 - Platform
- June 2018 - Platform
- April 2018 - Platform
- March 2018 - Platform
- March 2018 - Windows Agent 4.14
- March 2018 - Linux Agent 2.9
- February 2018 - Platform
- February 2018 - Windows Agent 4.13
- January 2018 - Windows Agent 4.12
- January 2018 - Windows Agent 4.11
- January 2018 - Linux Agent 2.8
- January 2018 - Linux Agent 2.6
- January 2018 - StackifyLib 2.1
- Other Announcements
- Insights
- Website Monitoring and Alerting
- Alert Notification and Escalation
- Leveraging Retrace for the Different Application Support Levels
- Application Cloud Migration and Re-architecture Journey
- Using Retrace as a key DevOps CI/CD automation tool
- ITIL v4 Service Management – Service Operations Processes
- Problem Management – Key to Achieving Operational Excellence
- OTel Appliance - Put your serverless and containerized apps on Retrace
- Open Telemetry: Under The Hood
Article summary
Did you find this summary helpful?
Thank you for your feedback
A big part of the Retrace equation is making sure you have good visibility into your production resources. This includes Apps, Servers/Roles/VMs, and Resources (websites, database queries, Azure Service Bus Queues/Topics, Files, etc.).
As a Getting Started exercise, we will point out some of the things you will want to focus on to ensure you're getting the best visibility possible into everything that's going on in your application and environment.
Setting Up Thresholds, Ranges, and Waiting Periods for Your Alerts
For both Server Monitor Templates and App Monitoring, you will have the option of establishing when an Alert will trigger. You do this by setting when and how an alert for a monitor fires.
Thresholds and Ranges
The first step is to establish what the threshold or range is. For example, if you wanted to receive an alert when CPU% for a server is greater than or equal to 95%, you would enter >=95 as the threshold. You can also control to be alerted when the monitor is within a range or outside of a range. As shown above, the operators (>, >=, <, <=, =, !=) are used to define thresholds and ranges.
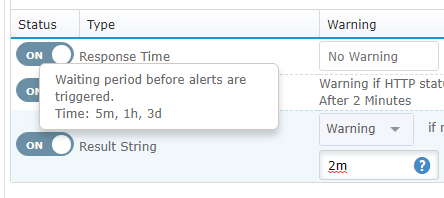
Waiting Periods
The next step is to establish the condition that will cause an alert to trigger after the threshold or range has been met, also referred to as the **waiting period. **An alert will trigger if the monitor is continuously above the threshold for the amount of time specified. As shown below, m(minutes), h(hours), and d(days) are used to specify time.
Configuring App and Resource Monitors From App Dashboard
Once you have installed the Retrace Monitoring Agent on at least one server running an App you want to monitor, you should see Apps in the Stacks page. From there, choose your App and configure App and Resource monitors in the App Dashboard.
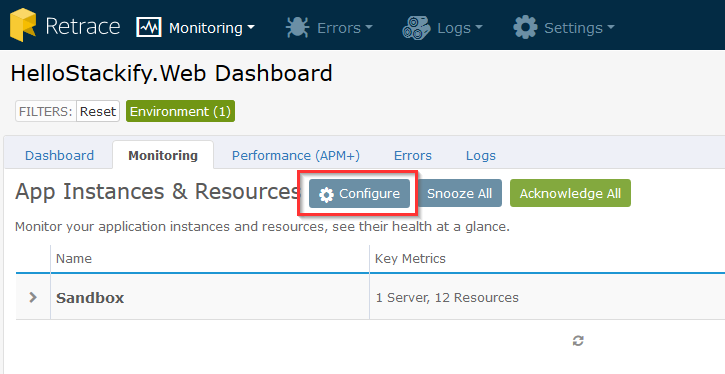
To learn more on configuring monitoring for Apps, visit Configuring App Monitors. Below will show you how to add additional monitors to your servers.
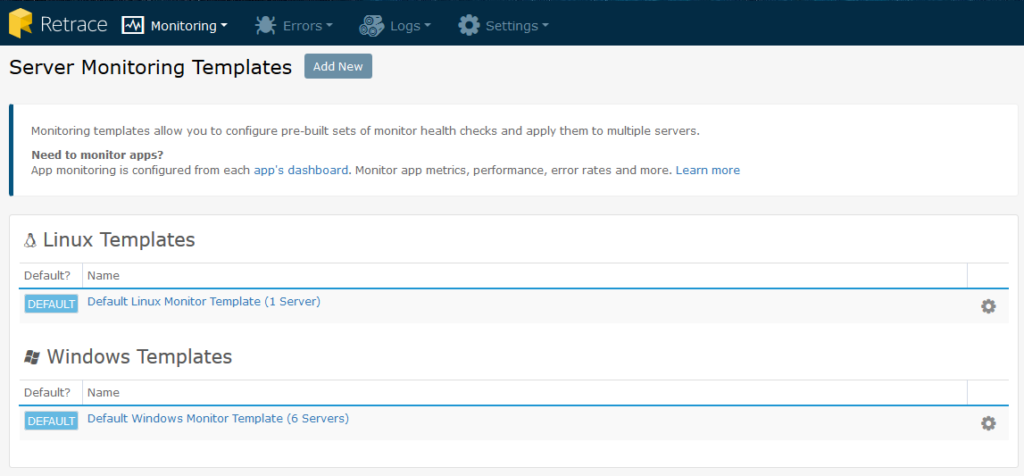
Configuring Server Monitors
The best way to set up monitors for your servers is with Server Monitor Templates. This feature allows you to set up templates with monitors and alerts and then assign servers to the template. This is a fast and easy way to ensure consistent monitor configuration for servers. To learn more about this feature and how to best use it, see the article on Server Monitor Templates.
Once these monitors are configured, you will be able to view the status of the server in the Server Dashboard.
Was this article helpful?
Thank you for your feedback! Our team will get back to you
How can we improve this article?
Your feedback
Comment
Comment (Optional)
Character limit : 500
Please enter your comment
Email (Optional)
Email
Please enter a valid email
