Retrace does not support APM for Node.js applications but you can capture errors and log and view them within Retrace. We support both the Winston logging framework and logging directly to our API. To configure your Node.js project with the Stackify API to send Errors and Logs to Retrace, follow the information below. Stackify API for Node.js using the Winston …
Errors and Logs: Overview
Stackify’s Errors and Logs API enables you to get more from what you’re logging. Simply plug in a Stackify appender into your existing framework, or log your messages directly to Retrace without a framework via the Stackify API. Once properly configured, you will be able to get more contextual information about your exceptions, view your app’s log messages, begin correlating exceptions …
Logs: Querying Logs
Retrace’s log management allows you to view and search across all of your logs in one place. Full text indexing powered by Lucene is used to create powerful searching capabilities. Most Lucene style searches are supported. Tips for Searching Through Logs Operators By default searches use the AND operator and must match all terms. These two queries are the same: …
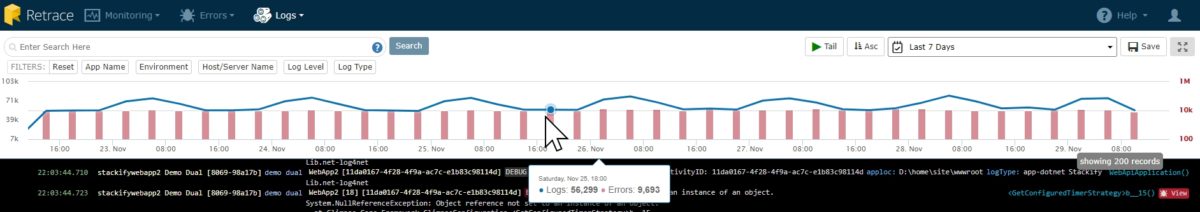
Logs: Filters and Fields
It can be a challenge locating a specific log message when Errors and Logs from different servers, apps, and environments are are constantly being captured by the Errors and Logs Dashboards. With the improved Filters and Fields solution, you can easily zero in on a certain error or log message by simply applying the right fields and filters to your …
Errors and Logs: App Dashboard Tabs
The Errors and Logs tabs in the App Dashboard are very similar to the more general Errors and Logs dashboards but are filtered to a specific app. Errors Tab The Errors Tab will present a list of all errors for the App. By clicking on the number of errors on the right side, you will be brought to the Errors …
Logs: Calculate Log Storage
For every 1 GB of data storage in Retrace for Errors and Logs, you can send approximately 2-3 million log messages, or roughly 500 K to 1 million errors. The exact number of logs per 1 GB of data depends on factors such as how much text each log message includes, how large the stack trace is in your exception, …
Logs: Log Collectors
In the Settings Log Collectors, you have the ability to send logs that are found on your server to Stackify so you can view them in the Retrace Logs Dashboard. These logs are collected by the agent, so each server will need a running Retrace Agent to be able to send these logs to Stackify. For a Windows Server, these …
Errors: Dashboard
The Errors Dashboard is meant to be a dashboard that will give you more insights to errors that are occurring in your applications. Here you will start getting more contextual information about your exceptions, begin correlating exceptions with other problems, and even monitor error rates in your production applications to detect error spikes. If you have not already added the …