The App Dashboard is a powerful monitoring and troubleshooting perspective that gives you a view of application health across one or more environments. The App Dashboard is broken down into a few key sections. At the top of this Dashboard you’ll see that you can view the Environments that the App is in and time ranges that you want to …
Errors and Logs: App Dashboard Tabs
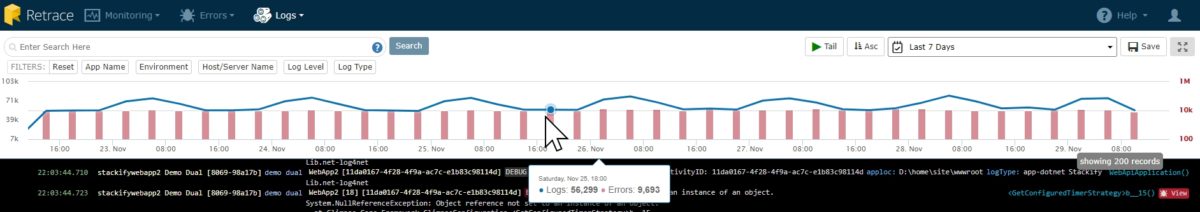
The Errors and Logs tabs in the App Dashboard are very similar to the more general Errors and Logs dashboards but are filtered to a specific app. Errors Tab The Errors Tab will present a list of all errors for the App. By clicking on the number of errors on the right side, you will be brought to the Errors …
Logs: Calculate Log Storage
For every 1 GB of data storage in Retrace for Errors and Logs, you can send approximately 2-3 million log messages, or roughly 500 K to 1 million errors. The exact number of logs per 1 GB of data depends on factors such as how much text each log message includes, how large the stack trace is in your exception, …
Account: Errors and Logs Retention Times
Errors in the Errors Dashboard and Logs in the Logs Dashboards by default are retained for 30 days before they are deleted. We also offer plans for 60 day or 90 day retention. To update to longer retention plan, navigate to the Settings>Billings page and click on “Update Service Plan” Once a log message reaches an age of older than …
Release Notes: July 2014
A Revamped Apps Dashboard The newly designed Apps Dashboard will give you an organized look into important insights about your application. View App Health View important App health information related to your application. This will give you a quick view to monitor resources needed to keep your app running properly. View App Performance From the performance view you …
Release Notes: June 2014
Below are some of the new features and improvements from the June 2014 release: An Improved Error Dashboard Screen The re-designed Error Dashboard will give you a lot more power to diagnose issues with your applications, including the ability to isolate different error types and filter through environments or applications. New Log Aggregation (Beta) Stackify has a new Logs …
Errors: Dashboard
The Errors Dashboard is meant to be a dashboard that will give you more insights to errors that are occurring in your applications. Here you will start getting more contextual information about your exceptions, begin correlating exceptions with other problems, and even monitor error rates in your production applications to detect error spikes. If you have not already added the …
Integrations: Jira
Using the Jira Cloud integration you will be able to push logging exceptions from Stackify into Jira work items. Fill out the URL, Username, and Password fields and select “Save” to configure the integration page. Sharing Your Exceptions Go to the Errors Details page by viewing an error in the Logs Dashboard or Errors Dashboard and click “Share”. Then select …