Retrace is a powerful new feature and serves as a core part of our Application Monitoring service. The feature implements byte code inspection of Java apps, giving you method-level telemetry on CLR code at run time. Use this tool to get instant insight on:
- Start time / end time and HTTP status codes
- HttpHandlers and HttpModules utilized in the IIS pipeline
- Call Stack of key methods / pipeline execution steps, i.e. controller execution, viewing compilation, and viewing rendering
- MS SQL database calls, including the query text
- Web service calls, including the requested URL
- Redis cache calls
- Request Queuing & Blocked – Estimations in delays of processing the request. Queuing being time before the request is started and blocked is time it was delayed after it was started.
- Call Stack and timings of other methods that are “opted in” for profiling. (To see how to add custom methods to be profiled, click here)
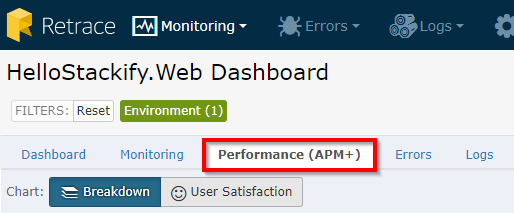
Once the profiler has been configured and enabled, the Retrace Agent will be able to facilitate data collection and push that data to your Retrace account. To view APM+ data, go to Monitoring >Web Apps and open the App Dashboard for a Web App that has profiling enabled. Once in the App Dashboard, click on the Performance (APM+) tab.
Using the APM+ Tab in the App Dashboard
When you click on the the Performance (APM+) in an App Dashboard, you will be able to view a breakdown of your average page load times by components that make up your app. Quickly see if database queries, caching, queuing or other parts of your stack are causing app slowness. You can also click on “User Satisfaction” to view a chart of Fast, Sluggish, Slow, and Failed requests based on the goal you set for response times.

Overview
The Overview tab will give you a quick look into the top 5 Requested Actions, the top 5 Queries, and the top 5 external web services, all sorted by the percentage of time it accounted for. To the right of each “Top 5” table is a chart to visualize the top web requests, top queries, and top external services. At a glance you will be able to see where bottlenecks are occurring, where web requests are spending the most time, how many total calls are being made, and so on. Click on any requested action or SQL query link in the tables to see a more detailed performance view for that requested action or query.
There are a number of different views you can select to help you investigate app performance issues. These different views include By Request, SQL Queries, Web Services, Tracked Functions, Servers. and Traces.

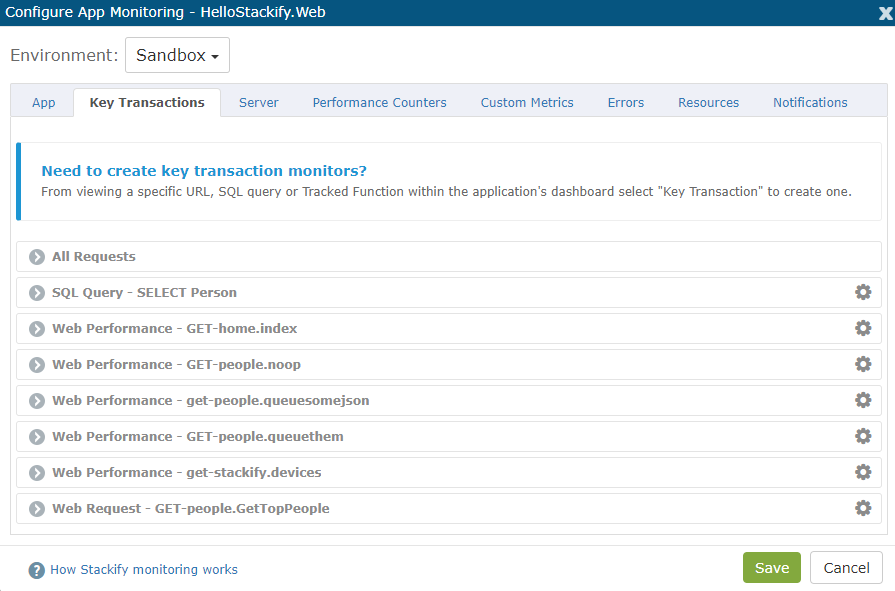
Monitoring and Alerting on Performance
You can also monitor Key Transactions for specific URLs, Tracked Functions and SQL Queries using Retrace APM+. For configuration guidance, see the documentation on Configuring App Monitors.