If you take advantage of Azure Service Bus, you will likely want to keep an eye on your Queues, Topics, and Subscriptions. Here’s how to do it. Configuring Service Bus Queues From the Queue Monitors page, you will be able to add new Azure Queue and RabbitMQ Monitors. Azure Queues Configure an Azure Connection You will have an option to …
Logs: Calculate Log Storage
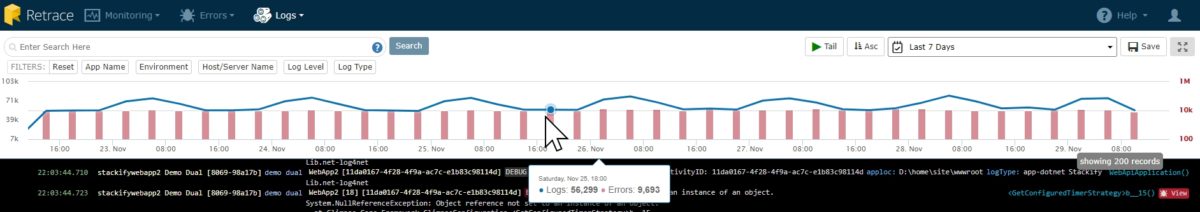
For every 1 GB of data storage in Retrace for Errors and Logs, you can send approximately 2-3 million log messages, or roughly 500 K to 1 million errors. The exact number of logs per 1 GB of data depends on factors such as how much text each log message includes, how large the stack trace is in your exception, …
Custom Metrics: Configure for Java
Retrace supports the monitoring of custom metrics for Java web applications. Metrics are reported to Stackify once a minute. They are only reported if you log a value within that minute time frame. See advanced settings below about overriding that default behavior. All metrics have a category and metric name. It is recommended to group similar metrics under a single category …
Servers: Remove A Server
There may be times when you want to remove a server or add back a server that you removed previously. Here are the steps: Click on the Settings Icon for the server you want to remove Find “Remove Server” Confirm the Removal Once the button is pressed a remote command is sent to the agent to uninstall. In order to …
Alerts and Notifications: Overview
Retrace gives you the ability to see all active alerts in a single location under the Alerts screen. Here, you can see all active alerts grouped for easy visibility across the entire install base, and you can respond to the alerts from here as well if you wish. Alerts From the Alerts page, you can sort alerts (within each server …
Logs: Log Collectors
In the Settings Log Collectors, you have the ability to send logs that are found on your server to Stackify so you can view them in the Retrace Logs Dashboard. These logs are collected by the agent, so each server will need a running Retrace Agent to be able to send these logs to Stackify. For a Windows Server, these …
Errors: Dashboard
The Errors Dashboard is meant to be a dashboard that will give you more insights to errors that are occurring in your applications. Here you will start getting more contextual information about your exceptions, begin correlating exceptions with other problems, and even monitor error rates in your production applications to detect error spikes. If you have not already added the …
Errors: Error Details and Sharing Options
In the Errors Dashboard you can view an Error Detail page to get a more thorough and in-depth look at both recurring errors and individual errors. The information about all the errors you gather here will be helpful for diagnosing why your app is not working as planned. Read below to see the features of Error Details. Recurring Errors You …